We provide OEM energy solutions for military and government, as well as private sector applications, helping clients achieve 100% up-time for applications ranging from Hospitals, school warning signals to explosion proof street lights.Applications:
Commercial - Industrial - Disaster Relief - Military and Residential
OkSolar.com Affiliate

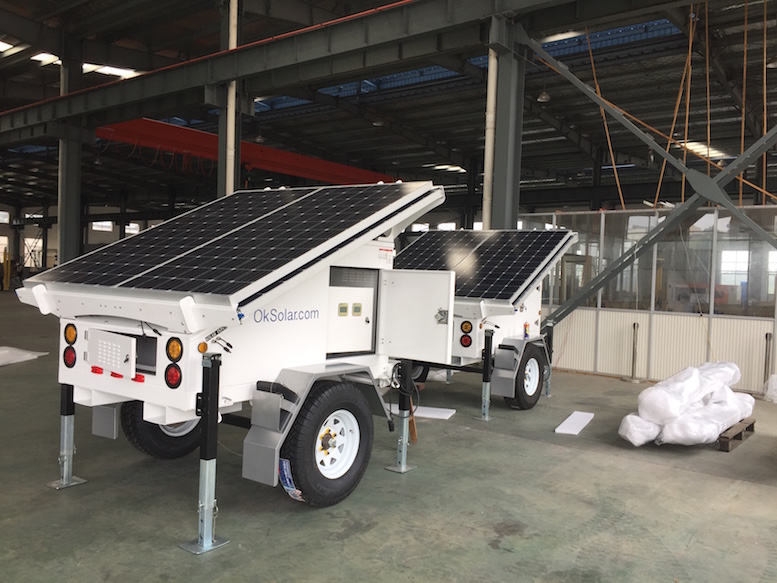
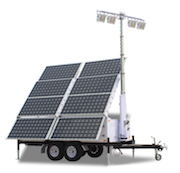
IP Video Anywhere Solar Powered!
Protecting Critical Government Infrastructure
Military and Homeland Surveillance
IP Video AnyWhere Solar Powered!
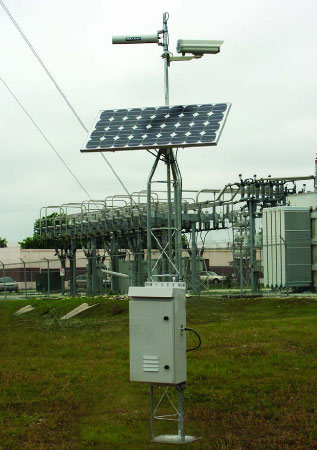
IP Video solutions are the next wave in CCTV surveillance. The ability to monitor your systems from anywhere, IP video solution.
Keep an eye on your critical facilities at all times.
With OkSolar’s IP Video Anywhere, you can monitor sites several thousand miles away as if they were across the street. Our system facilitates remote site surveillance through energy-independent operation and allows video to be transmitted over IP without any physical lines being installed. Companies with remote or hard to access assets, such as oil and gas pipelines, bridges or rural properties, have not had an effective, economical solution for protecting those assets. Some of the features like automated archiving allow you not only to track construction progress in real time but also to retrieve past images which can be used to resolve issues quickly.
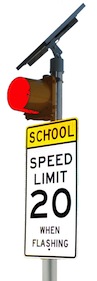
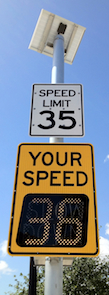
Traffic Warning Signals
Our 12', 2 Head, Solar powered school warning flasher signal is the cost effective solution to your pedestrian safety problems. More Information > Traffic control lights, LED Traffic signals Manufacturer & Distributor, School Zone LED, School Zone LED flashing beacon, 24 7 hour led flashing beacon traffic, school zone, School warning signals, 24 hours warning Flashers, Road way warning signals, pedestrian crossing, railroad warning, ice on bridge warning, low water crossing, led beacons, speed awareness displays, Solar Powered Pedestrian Beacon, Pedestrian Beacons, 24/7 Flashing Beacon
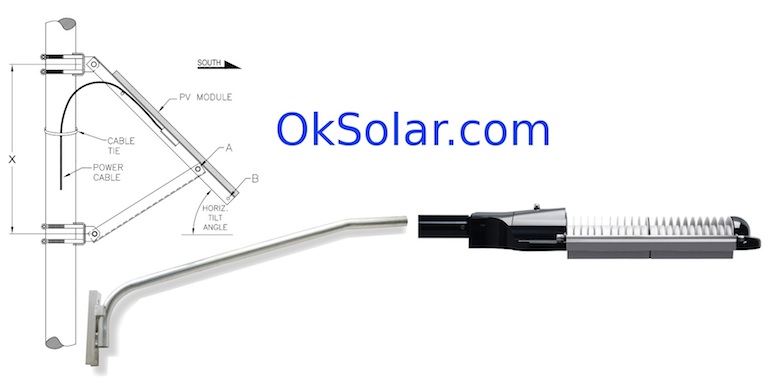
SolarLighting
Complete turn key Systems Solutions for Solar Lighting
All components needed for installation are included (except for the mounting pole). The systems are designed for installation onto a wood, concrete, or metal mounting pole. You may choose to use your own pole or we can quote the poles separately from the lighting system itself.
These units can be used for: Area lighting, Billboards lighting, Dock lights, Park lighting, Parking lot lighting, Parkway lighting, walkway lighting, Street lighting, Transit Lighting, Outdoor area lighting
Complete turn key Systems Solutions for Solar LED Lighting
Solar Tree
We Delivered On-Site For Fast Plug and Pay Installation Solar Tree structure are designed for the following applications:
-Shading vehicles from the sun and at the same time generate Green energy.
-Facilitate the creation of infrastructure for electric vehicles.
One Solar Tree structure system shades eight standard parking spaces.One Solar Tree structure generates enough energy to fully charge eight electric vehicles each day or power Office Space, Industrial plants or a House. We Ship Worldwide in site technical support available.
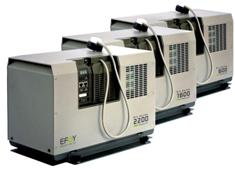
Fuel Cell Are you tired of your devices being left in the dark, when your solar energy system stops providing power? Then IQ Fuel Cells are the perfect answer for you. Are now available as an alternative source for renewable energy. Unlike traditional power generators, they don't require gasoline to generate power. They also provide an alternative to solar generators because they do not depend on any external power gathering equipment. These units are compact, durable, and built to power a wide range of applications.
The Best Generator Ever!
Applications: Airports, Computer Rooms, Hospitals, Traffic, UPS
Smart designs with IQ Fuel Cells for smart energy applications Contact us today!
Battery Backup Systems for LED Traffic Signs Increase the public safety and reduced traffic congestion by allowing traffic lights to function even during a power failure. A typical traffic signal intersection experiences eight to ten local power outages annually. With IQUPS battery backup power, some or all the traffic control signals can continue to operate. This seamless switchover to battery power increases public safety and eliminates the need to dispatch police or other service personnel to direct traffic. If all traffic signals were converted to LEDs, the battery backup system would allow full operation of the traffic signals during a power outage, thus alleviating traffic congestion.
Important feature is the battery backup system’s ability to maintain the memory of the traffic signal controller. The controller is responsible for sequencing the on and off times of the various signals. With a battery backup system, the controller’s memory can be maintained and return to normal operation once the outage has ended. This feature has eliminated the time spent to reprogram controllers after a power outage
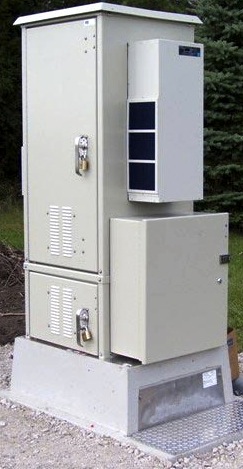
Traffic IQUPS It is designed to provide backup power for critical LED traffic light intersections. With 1,000 watts of true sinewave power available, IQFuel Cell and maintenance free Deep cycle batteries.
Traffic IQUPS will drive most large LED systems. Its pure sinewave output is cleaner than utility power, making it ideal for all loads.
Total distortion is typically less than 1.5%. Manufactured in the USA to the highest standards possible, Traffic IQUPS system is the best choice for critical load protection. power outage knocked out traffic lights, backup generators, emergency generator
Depending on the consumers needs, the IQFuelCell automatically charges the battery with up to 100 Ah per day. As independent power supply or in combination with other systems, the IQFuelCell runs self-sufficiently for months.
The circuit is fully protected via breakers and fuses on the AC input, connection to the batteries, and DC loads. Outdoor, lockable, aluminum enclosure includes tamper-proof hardware suitable for pole or wall mounting. DC.
IQAirport
Airport and Heliport landing back-up Battery Charger: 12Volts, 24 Volts, 36Volts, 48 Volts -120VAC or 230VAC Using state-of-the-art, switch-mode technology, the DLS Power Supply series is engineered with the user and variable environmental conditions in mind. Extra care has been given to insure many years of service-free operation, even when subjected to extremely harsh conditions. Batteries are charged quickly and efficiently without over charging and pumps, motors, and fans operate perfectly for prolonged life.
OkSolar.com has decided to adopt QR-Codes in our manufacturing process to streamline support and maintenance in all of our applications, resulting in savings for Government Agencies.
Projects:
Projects
Battery
Storage for Smart Grid IQUPS.com Renewable Energy - Solar PV Plants -
Electric Car Charging Stations - Smart Grid.
BBS Battery Backup system for Obstruction Lights Obstruction Lighting.
Buoy-Based Security System For Ports - How to Secure Ports - Obstruction
Lighting - Marine Lanterns - Infrared LED Red Beacon.
OkSolar Projects Commercial Industrial
and Military - Hospital Solar Power Solutions.
Electric Vehicle Charging Station Solar Powered - How To Create a System to
Solar Power Electric Cars.
How To Create a System to Solar Power Electric Cars.
How to Install a Obstruction Lighting in a Wind Turbine - Wind Turbine
Lighting.
How to Install a Solar Powered Obstruction Lighting in a Wind Turbine -
Solar Powered Wind turbine Obstruction Lighitng FAA Certified.
How to Secure Ports -
Obstruction Lighting - Marine Lanterns - Infrared LED Red Beacon
How to use a BBS Battery Backup system for Obstruction Lights Obstruction
Lighting.
Modular Energy Storage Solar Powered, Wind and Fuel Cells Assisted
Substantially reduces the requirement for diesel fuel and the associated
costs and logistics and attacks..
Military Modular Energy Storage Solar Powered - Wind - Fuel Cells Assisted
Substantially reduces the requirement for diesel fuel and the associated
costs and logistics and attacks.
IQUPS.com Develops Modular Power Storage for Renewable Energy - Solar PV
Plants - Electric Car Charging Stations - Smart Grid.
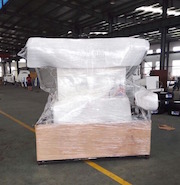
Shipping
Containers Solar Powered - Modular Energy Storage Solar Powered Wind
Assisted.
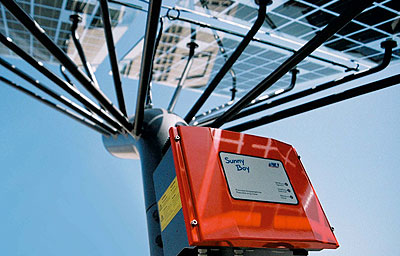
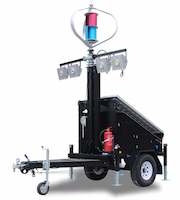
Skystream Hybrid 6 wind-solar system increases energy production of the
solar array by up to 35 percent compared with a fixed mount system.
Solar LED Street Lamp -
Obstruction Lighting - Marine Lanterns - Infrared LED Red Beacon
Solar Powered Obstruction Lighting for Wind Turbines.
Solar Powered Obstruction Lighting for Wind Turbines Generators -
Obstruction Lighting Solar Powered.
Solar Powered Schools
Self Powered by a Shipping container.
Wind Turbine Generator Obstruction Lighting Solar Powered.
Wind Turbine Lighting -
Solar Powered Wind turbine Obstruction Lighitng FAA Certified.
Wind Turbine Obstruction Lighting Solar Powered FAA-Certified L-864.

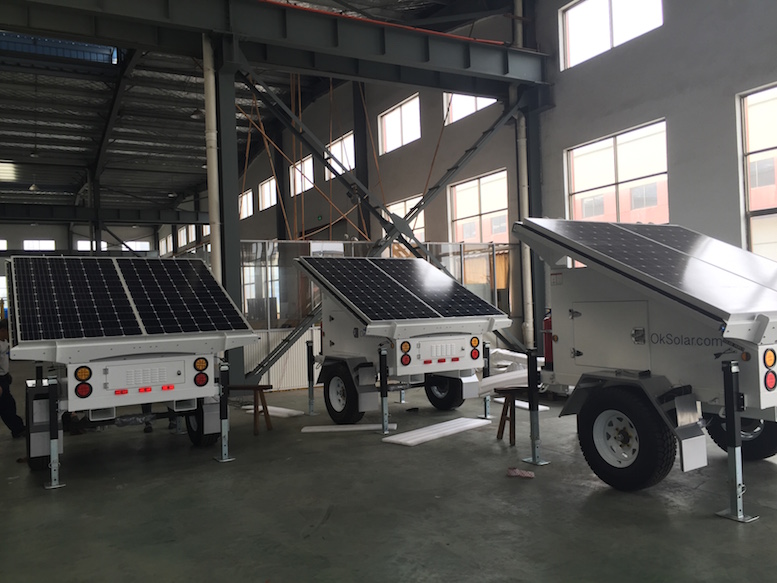
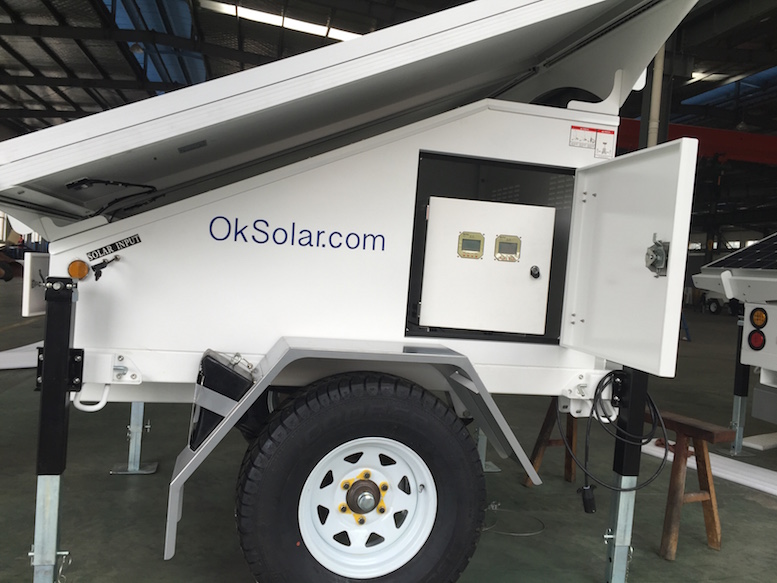
Other Models Available
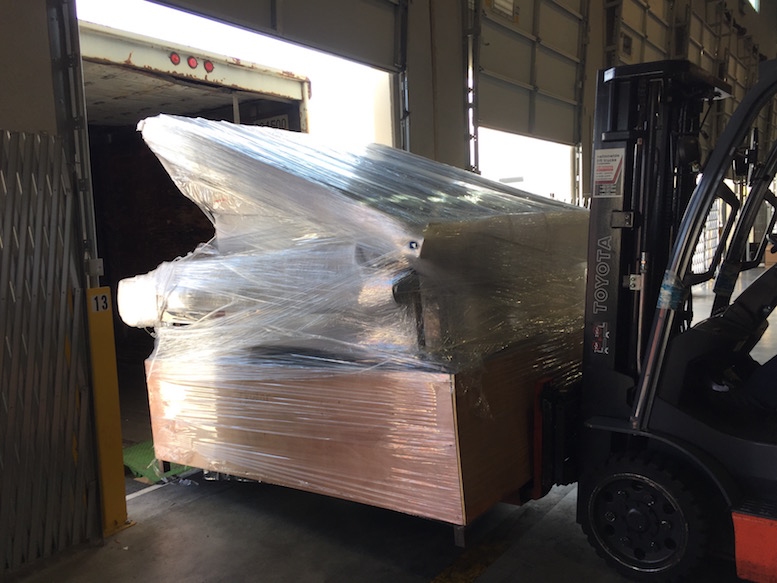
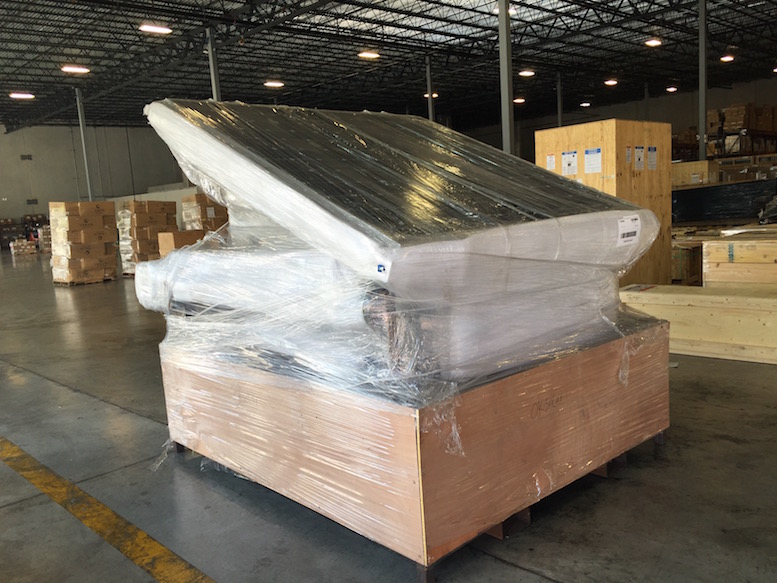
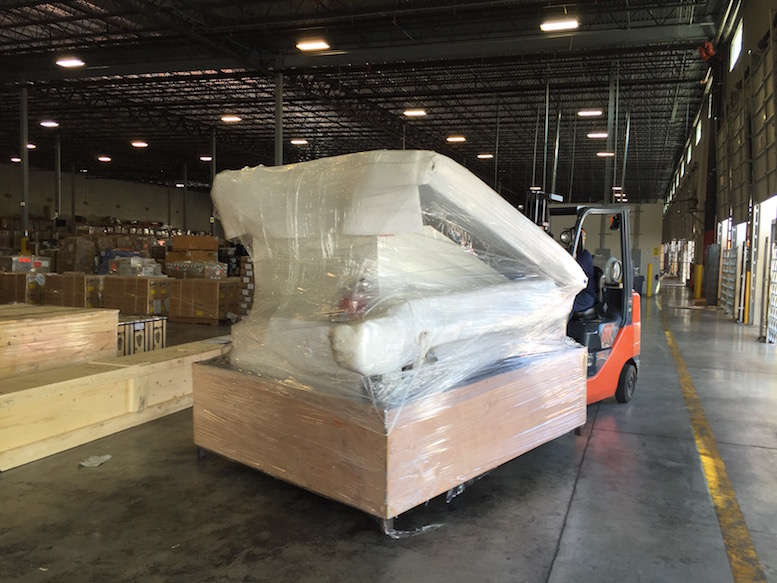
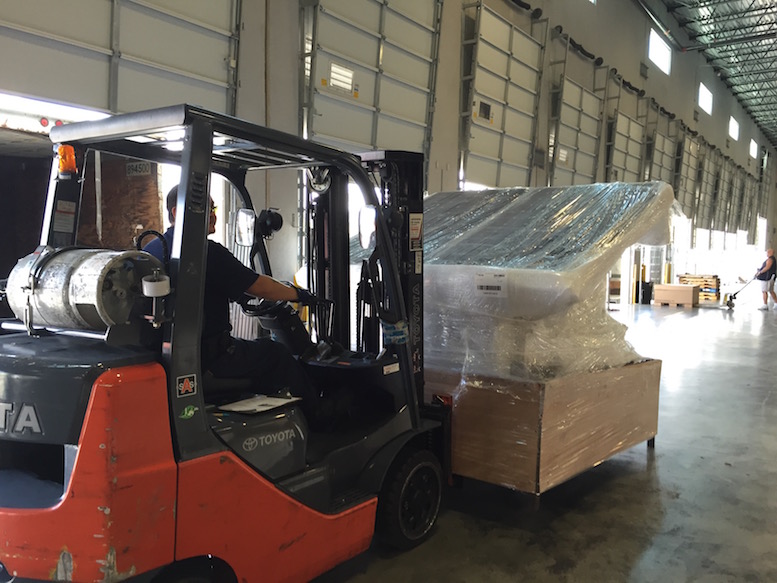
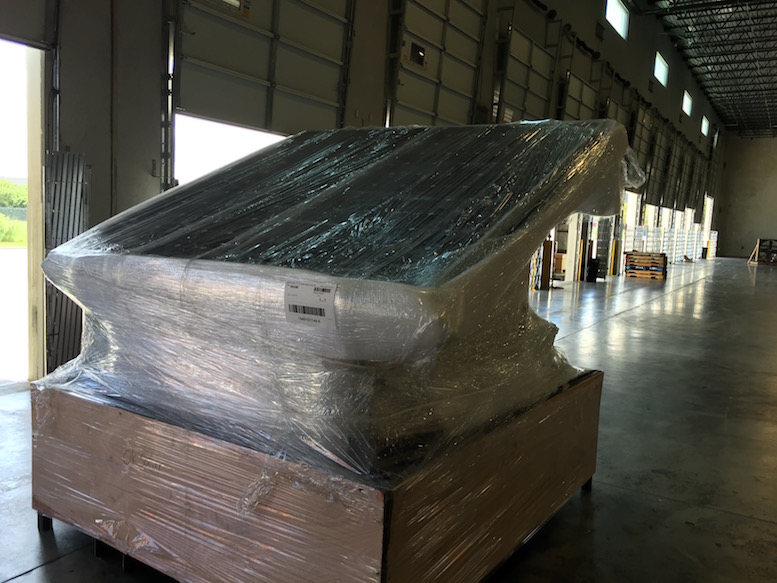
Sample Ready to ship unit
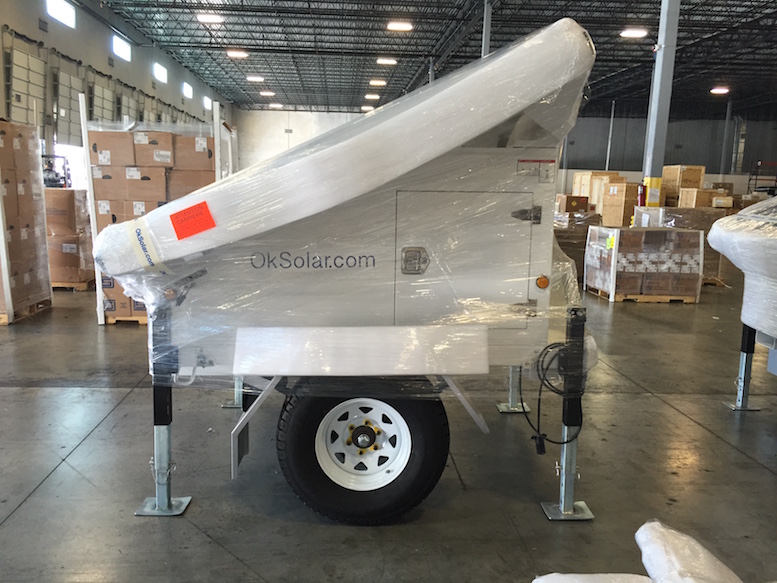


.
|